
It’s Friday night, and all you are craving after a long week is a good ol’ pizza. When you get your Friday fix, what do you consider? Price, calories, deep dish, or if you are feeling fancy, a stuffed crust? Well, would you ever consider the carbon emissions? Well, you might have to in the new age of climate change with the food industry having a greater impact than ever.
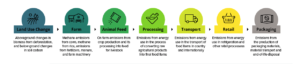
Have you thought of the carbon emissions associated with the individual toppings of the pizza – the dough, tomato sauce and cheese? Not to mention the plethora of toppings you can have. So in order to analyse the impact of the humble ingredients of a pizza, there are stages of the production that need to be taken into account from land use, processing, transport and packaging.
So, let’s start with the base. Wheat flour is the most common type of flour. Wheat has reduced GHG emission than rice, but it still produces 5455 kg ce/ha per unit area or 0.75 kg ce/kg per unit yield. The mill production of the flour accounts for a high proportion of the emissions produced as it is an energy-intensive process. 37% comes from electricity consumption for irrigation, 28% from nitrogen fertilizers, 25% from fuel consumption by agricultural machinery and 6% from straw burning. Having the equivalent of 1 slice of bread made with wheat flour
every day of the week, on a yearly basis, this totals:
- 12kg to your annual greenhouse gas emissions.
Which is the equivalent to:
- Driving a regular petrol car 32 miles (51km).
- The same as heating the average UK home for 2 days.
- Uses 5,140 litres of water, equal to 79 showers lasting eight minutes.

Secondly, we have the tomato. Worldwide, there was an increase of +419 % in production from 1960 to 2009, with an increase of area and yield from 2000 to 2009 of 24 and 4 %, respectively. There are obvious variations across the world with different regions having more suitable climates for tomatoes. For example, in the UK, 97% of the GHGs from tomato production come from heating. Moreover, this varies with the types of farming systems. Organic unsurprisingly has the lowest impact of GHGs in production with under 200 gCO2ekg-1. But conventional farming has much higher rates that are primarily based on packaging, storage and transport.

They vary from 650-950 gCO2ekg-1. If you have tomatoes 3-5 times a week, on a yearly basis this equates to:
- 34kg to your annual greenhouse gas emissions
Which is the equivalent of:
- Driving a regular petrol car 89 miles (143km)
- Heating the average UK home for 5 days.
- This uses 6,153 litres of water, equal to 94 showers lasting eight minutes.
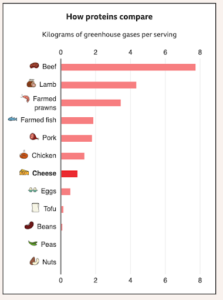
And finally, in my opinion the best bit, the cheese. There are actually very different impacts when it comes to carbon emissions for cheese due to the variation in types and way they are made. For example, the cheeses that take longer to mature, typically use more milk so they have a higher carbon emission. Softer cheeses such as feta, brie, mozzarella and camembert have lower carbon emissions.
Cheddar produces 8.6 kg CO2e compared to 7.28 kg CO2e from mozzarella. But based on the data of cheese, having it 3-5 times a week, over the course of the year, this would equate to:
201kg to your annual greenhouse gas emissions.
That’s the equivalent of:
- driving a regular petrol car 514 miles (827km)
- Heating the average UK home for 31 days.
- Uses 47,259 litres of water, equal to 727 showers lasting eight minutes.
- 740m² land, equal to the space of 2 tennis courts.
So as you can see, it’s not as simple as it may seem. One thing is for certain though; having a frozen pizza from the shop is likely to have carbon emissions 145 times higher than a homemade pizza. A typical Grandiosa pizza emits over 290 kg of carbon dioxide. Our research evaluated the CO2 emissions for the foods production, travel, packaging and preservation and these were the final results. The food production alone accounted for only 4.16 kg of CO2 (1.42%), refrigeration produced roughly 200 kg of CO2 (68.7%), Transportation made up 53.1 kg (18.2%) and packaging finished it off with 33.77 kg of CO2 and 11.6% of the total amount.
So this Friday when you want your next pizza, think about what goes into it, the processes behind it, and what impacts this may have on our climate. This is applicable to all food products and to provide more information, here is a useful link to find out more about your individual food choices: https://www.bbc.co.uk/news/science-environment-46459714